SBU Reporting in Power BI Navigation
Power BI Navigation
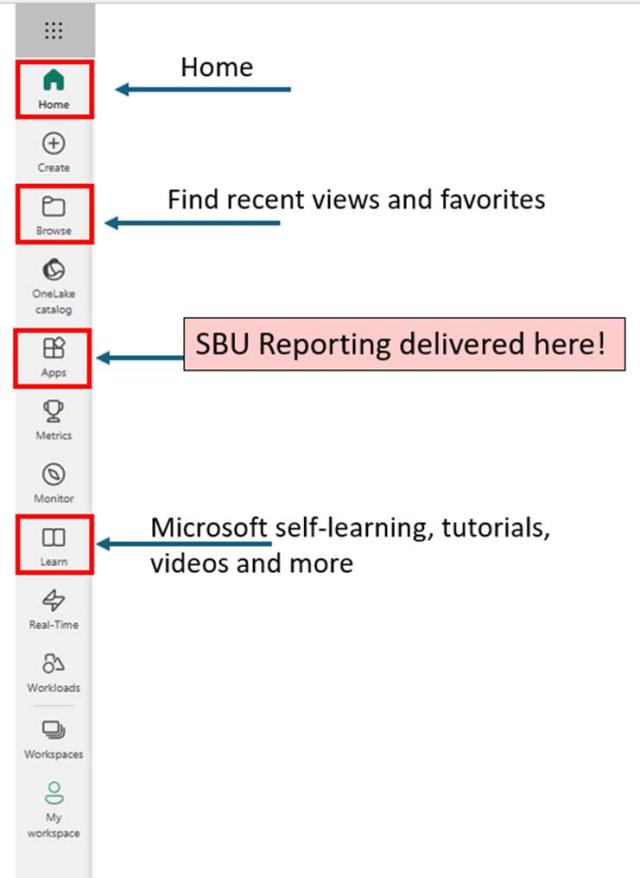
The Power BI primary navigation toolbar makes it easy to:
- Navigate Home,
- Find recent views and favorites through the Browse menu
- Launch SBU Reporting and other tools through the Apps link
- Access Microsoft Self-Learning Tutorials and Videos
Working with Apps
View, Sort and Filter
You can adjust the way apps appear in the Apps list or change the sort and filter settings through the apps toolbar.

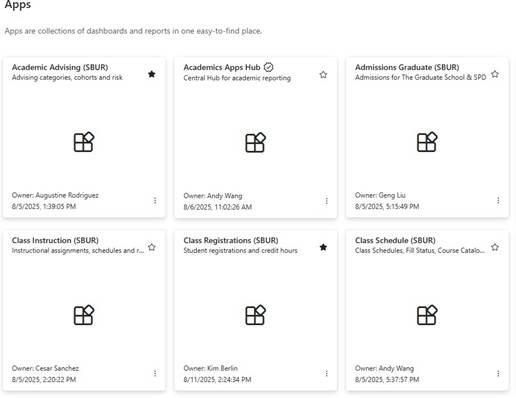
Tile Gallery View
The tile gallery view presents your apps in a grid card system that shows the app title, owner and other details
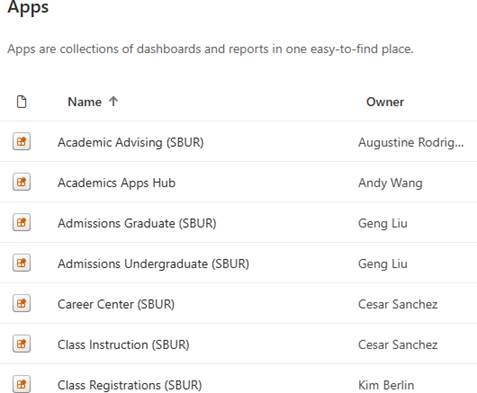
List View
The list view offers a more streamlined experience for browsing the available apps list.
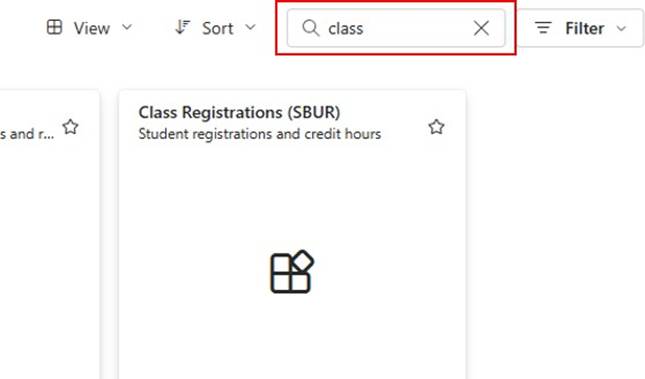
Filter by Keyword
You can filter the available apps list by using specified keywords.
Apps Hub
You can launch SBU Reporting Apps Hub from the Apps section in Power BI. This Apps Hub provides access to many different Admissions, Enrollment, Academic and Class Schedule reports.
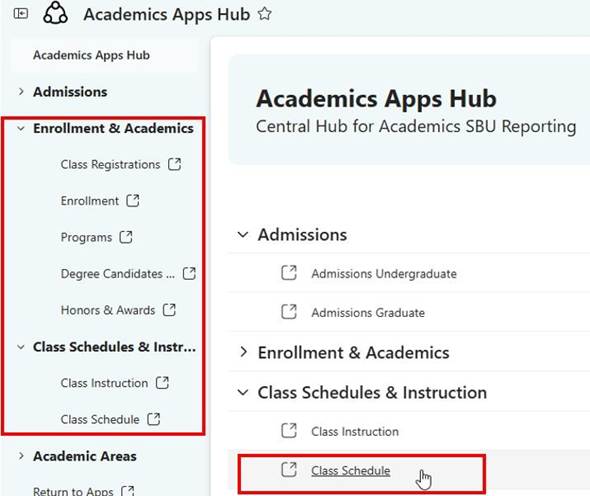
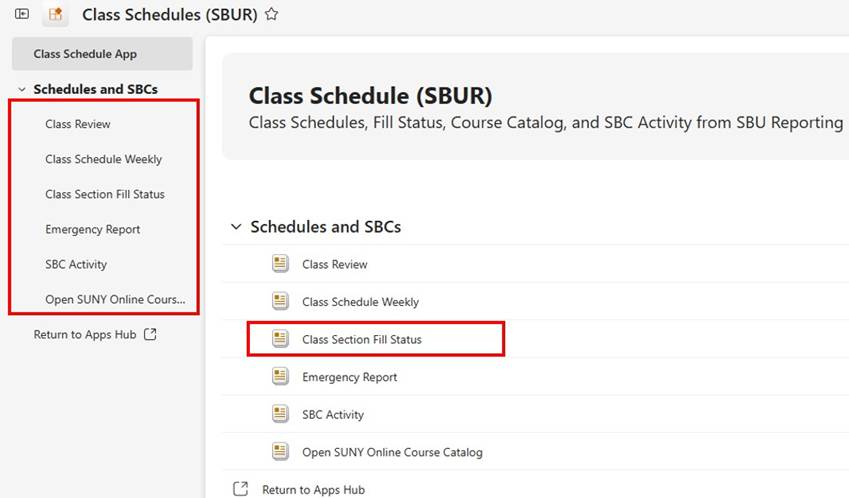
Running a Report
You can browse the reports available to you in either the left menu sidebar or in the applications main screen. Reports are categorized by various groups.
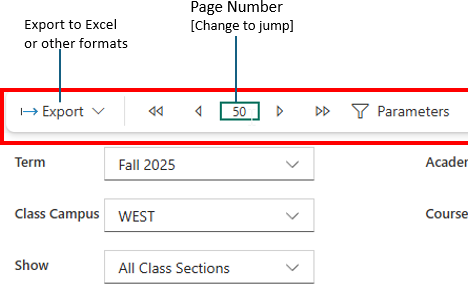
Export and Page Navigation
After selecting a report, you can use the report toolbar to export the report's data, jump or page through the report's data or specify parameters to modify the report.
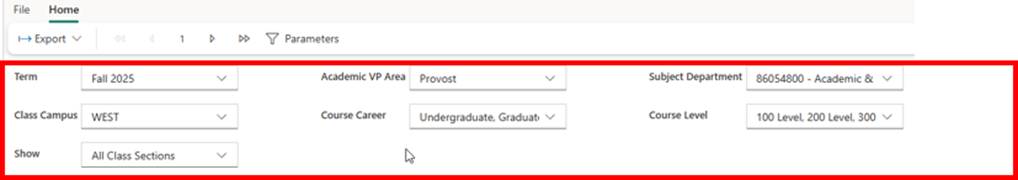
Selecting Report Parameters
When you click on the paramters button in the report toolbar you will be presented with a list of fields for that report which you can modify to customize the data returned by the report.